Inpatient Length of Stay Opportunity
Overview
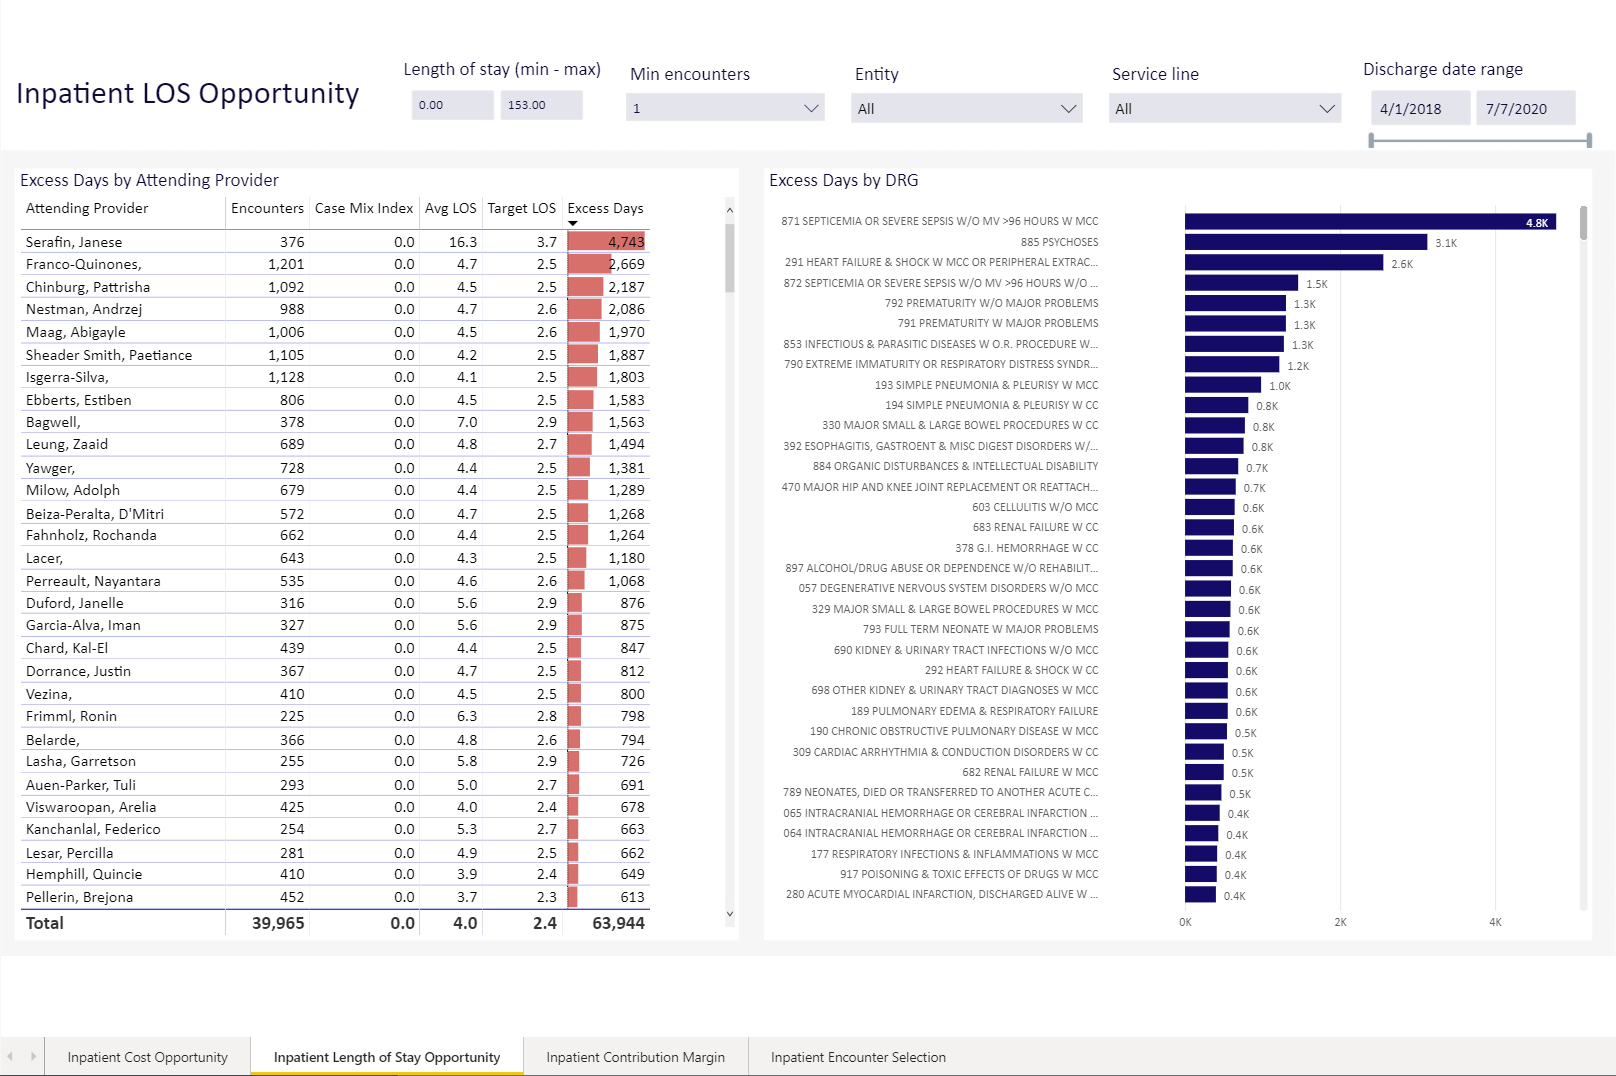
The Inpatient Length of Stay Opportunity report lets you evaluate excess hospital stays by attending provider and by DRG.
Click image to view full size
Slicers
This report provides filtering options to let you specify a group of attending providers or DRGs to examine.
Length of stay (min - max)
Use these two fields to enter the minimum and maximum number of days of hospital lengths of stay to examine in the reports.
Min encounters
Use this drop-down to select the minimum number of encounters that attending providers who have had in the date range you specified. The default is 1 encounter.
Entity
The entity drop-down lists all of the clinics, hospitals, and other entities that comprise your institution. You can choose to view all of those entities or select a single entity to view.
Service Line
Use this drop-down to select the service lines you want to examine in this report. You can select all service lines, a single service line, or several service lines. To select multiple service lines, press and hold the CTRL key while you select the check boxes for each service line you want to view.
Discharge date range
This control lets you select a range of dates of discharge. You can use the slider or, for more precision, click on each date box to choose a date from a calendar.
TIP: Use the dashboard tools to view, export, and sort the data; view data as table; and more.
Excess Days by Attending Provider
Click image to view full size
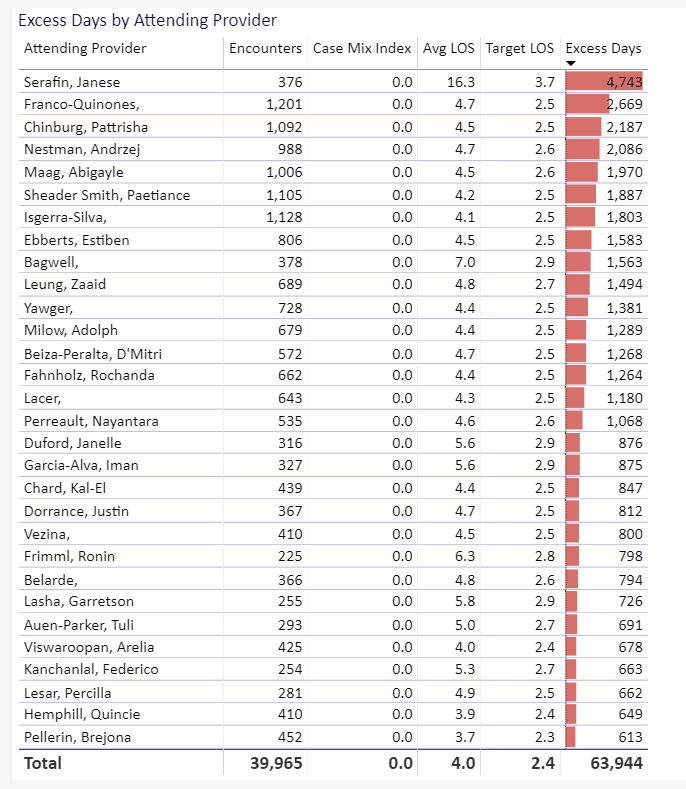
Use this report to examine length of stay data for all attending physicians, as specified in your data filtering.
| Attending Physician | The name of an attending physician. |
| Encounters | The number of encounters for that physician during the date range you specified. |
| Case Mix Index | A calculated value indicating the relative complexity of the patients seen. Case Mix Index is a measurement of the diversity, complexity and severity of illness of the patients seen at the hospital or by a provider. The higher the CMI, the more complex the patient and the more resources required to treat the patient. |
| Avg LOS | The average length of stay for all encounters for this attending physician. |
| Target LOS | The target length of stay for encounters, based on the specialty of the attending physician. |
| Excess Days | The number of excess days for an attending physician, which can be positive or negative. |
Excess Days by DRG

Click image to view full size
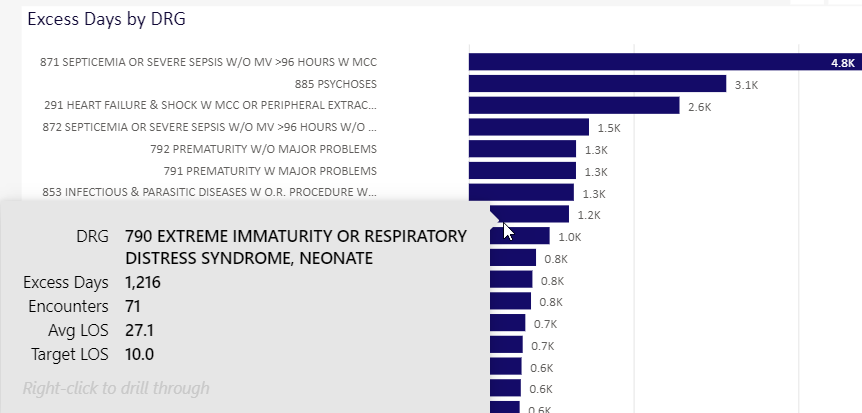
Use this graph to view excess length of stay days for each DRG hospitalization that matches the filters you specified. The total represented here are for all attending physicians that hospitalized patients for the DRG that match your specifications.
This graph displays excess days from the most number of excess days to the least number of excess days. The baseline of 0 represents target length of stay for each DRG.
Move your cursor over one the bars in the chart to view precise excess days data.
Click image to view full size
if you right-click from the hover box, you can view the data as a table or view a table of all encounters, each linked to the encounter record.
Navigation
-
Use the tabs at the bottom of the page to view other related reports in the category
-
Use the Navigation menu in the upper-left corner to return to Recent places that you've visited or to the Intelligence Center.